Diet formulation for Nile tilapia: towards sustainability amid global warming
WIAS Magazine – Summer edition 2024
Research Highlight
Keywords: macronutrients, digestibility, nutrient utilization, fish, rearing temperature
How does global warming link tilapia industries?
Nile tilapia (Oreochromis niloticus) ranks as the 3rd most produced finfish species, contributing 9% to the total global finfish production. Its production is on the rise, propelled by increased availability of formulated diets, paralleling the growing demand forecasted for the future (Figure 1). Sustainable production of these diets necessitates the use of alternative ingredients that supply the macronutrients (protein, fat, and carbohydrates) to mitigate food-feed competition. For sustainability reasons, investigation on the utilization of macronutrients has been done for Nile tilapia. However, temperature is a pivotal variable that affects metabolism. Tilapia are predominantly farmed in outdoor systems mostly in tropical regions, where temperature fluctuations occur seasonally, which is more patent nowadays due to global warming. Therefore, understanding the effects of temperature on nutrient utilization is paramount. This study assessed macronutrient utilization efficiency at 24 and 32°C, noting that this temperature range is within the non-stressful bounds for Nile tilapia.

Figure 1. Tilapia production from 2000 to 2017 (1) and estimated commercial feed usage from 2000 to 2025 (2).
How did we estimate the growth efficiency of macronutrients?
The efficiency of macronutrients for growth was estimated through a multiple linear regression analysis, which quantified the relationship between the amount of digestible protein, fat, or carbohydrates consumed by fish (expressed in g.kg−0.8.d−1) and energy retention (RE) in their body (expressed in kJ.kg−0.8.d−1). The resultant equation represents the relationship as follows:
RE = μ + (β1 × digestible protein intake) + (β2 × digestible fat intake) + (β3 × digestible carb intake)
In this equation, β1, β2, and β3 indicate the amount of energy deposited (in kJ) for 1 g of digestible protein, fat, and carbohydrate, respectively. The intercept μ represents the energy loss at fasting. To estimate the relationship between RE and digestible nutrient intake, a balance study was done at 24 or 32°C in a controlled indoor facility. Four diets with varying macronutrient compositions and 2 feeding levels were used to provide contrasts in macronutrient uptake necessary for regression analysis.
What did we find?
At 24°C:
RE = −28 + (13.3 × digestible prot intake) + (32.0 × digestible fat intake) + (10.9 × digestible carb intake)
At 32°C:
RE = −54 + (14.7 × digestible prot intake) + (32.7 × digestible fat intake) + (10.6 × digestible carb intake)
Observing the equations above, the fasting heat production (i.e., intercept) for Nile tilapia is approximately 50% higher at 32°C (28 vs. 54 kJ.kg−0.8.d−1). However, the fish did not show any difference in utilization efficiencies of macronutrients between temperatures. The interaction effect of temperature, dietary composition, and feeding level (the amount fish consume) was observed on nutrient digestibility. This means that the digestibility was affected by temperature, and the effect of temperature further influenced by dietary composition and/or feeding level.
What are the implications of the findings?
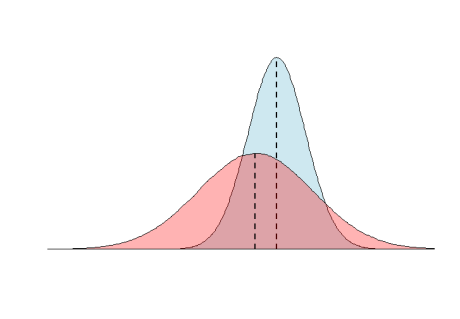
The consistent efficiency in utilizing protein, fat, and carbohydrate for growth suggests that the composition of Nile tilapia diets remains stable across temperatures, surely within the range of 24-32°C. Consequently, industries can employ the same equation within this temperature range. However, higher temperatures lead to increased fasting heat production, reflecting an elevated energy requirement for maintenance. As such, to achieve equivalent growth rates, fish reared at higher temperatures require higher energy or feed intake. This necessitates higher quantities of tilapia feed at 32°C compared to 24°C (Figure 2), resulting in comparatively elevated production costs for farmers.

Figure 2. Consequences regarding macronutrient utilization efficiencies and growth of Nile tilapia at different temperatures.
References
- FishStatJ FA. A tool for fishery statistics analysis. FAO Fisheries and Aquaculture Department, FIPS–Statistics and information: Rome, Italy. 2017.
- Tacon AG. Trends in global aquaculture and aquafeed production: 2000–2017. Reviews in Fisheries Science & Aquaculture. 2020 Jan 2;28(1):43-56.


